Chris Hasek
Summer 2014 Project
I have added some AJAX functionality to the lidar scan image animator. Users can now use the animator to view archived images.
My work for the rest of the summer may include assisting Keving Phung with his work on the atmosheric convective boundary layer. I am also looking into developing a program that would detect vorticies in our wind data.

Summer 2013 Project
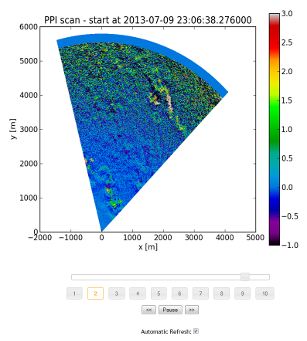
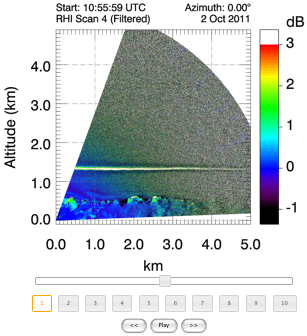
This year I improved the lidar scan animator that I developed last summer and implemented it to show data being collected from the REAL in near-real-time. The images are generated using Python and matplotlib. There are now separate PPI and RHI versions.
I am also automating the process that create frames and movies from the backscatter data in post-processing and add them to the web page.
Summer 2012 Project: Lidar scan image animator
This summer I am developing a web page that animates a series of lidar raster scan images. This could allow people to view the most recent scans collected by the lidar, and when the lidar is running someone could watch the air currents out at the University farm in (almost) real time.
I will be learning and using Javascript (and the Javascript libraries Jquery and Jquery UI) to develop the animation and its controls.
The page can be found here.
Summer 2011 Project: REAL Stares from CHATS
This summer I am extracting stares from the CHATS data set and putting the resulting time versus range intensity plots (like the one below) on this website.
Stares are created by holding the lidar beam stationary, as opposed to scanning the beam horizontally or vertically. The result is an image where the abscissa is time and the ordinate is distance. You can see the stares that are currently uploaded here.
For the CHATS experiment, stares were directed so that the beam passed just meters west of the NCAR ISFF vertical tower. By the end of the summer, I plan to have all of the stare images on-line with corresponding time-series plots of variables measured on the tower. This is being done to investigate whether the fluctuations observed in the backscatter data are correlated with any of the in situ variables such as relative humidity or vertical velocity.
Summer 2010 Project Description: Development of a GUI
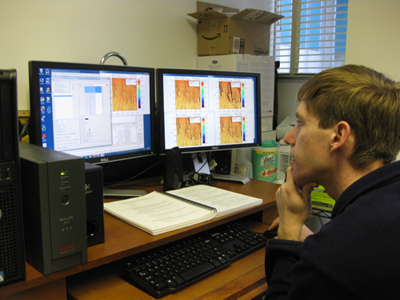
My summer project was to create a graphical user interface (GUI) to enable point-and-click use of scanning lidar display software. The scanning lidar display software was written by David Fanning and Dick Jackson and was used in a command line mode of operation by William Meadows to create the on-line library of REAL movies and images from CHATS. To create the GUI, I borrowed from David Fanning's Catalyst library. The display software and the GUI are written in Interactive Data Language (IDL). The value of the GUI is that it enables users to select scans and try parameters that control the appearance of the resulting scene without having to know them in advance and compose a long IDL command line instruction.
The GUI lists all of the scans within a REAL data file and allows the user to select one. It also allows the user to choose from filtered or unfiltered data, select the color bar limits, and horizontal and vertical ranges of data to be displayed. If NetCDF files of velocity data exist, the user can select one of those and superimpose the vectors, streamlines, or pathlines over the backscatter image.