Welcome to the GEOS 440, Environmental Sensing, webpage for the Fall 2021 semester.

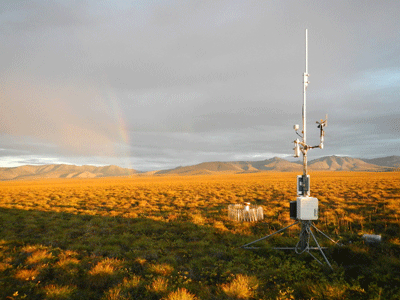
Weather Station in Alaska. Photo Credit: Frank Urban, US Geological Survey
This page will be updated every few days as the course progresses...
University Course Catalog description: Prerequisite: PHYS 202B or 204B. Instruments are critical to making quantitative observations, and observations are critical to the scientific method. The subject of environmental instrumentation is vast and constantly changing as new technologies emerge. Through a combination of lectures and hands-on projects, students are (1) introduced to the process of assembling and characterizing an electronic instrument of their own, (2) forming a hypothesis and testing it by collecting data, and (3) writing reports and giving presentations on their results. 2 hours lecture, 3 hours laboratory.
NOTE: Due to the continued spread of the Delta variant of COVID-19, this course will be held entirely on-line in the Fall of 2021. Instead of hands-on work with electronics in lab, we will use Interactive Data Language (IDL) to read, process, and visualize environmental data.
Fall 2021 Lectures: MWF, 12:00 - 12:50 PM. Location: On-line via Zoom.
Fall 2021 Labs: Mon. 2:00-4:50 PM, Tues. 2:00-4:50 PM. Location: On-line via Zoom.
Office hours: MW from 10-12 or by appointment. (Please e-mail me to schedule something.)
Mon., Aug. 23: Lecture: Review syllabus. Subjective judgements versus objective measurements.
Mon. & Tues. Aug. 23 and 24: Lab 1: Install IDL on everyones computers.
Weds., Aug. 25: Computers and computer components. Hardware and software.
Mon., Aug. 30: Complete software applications. Begin data: decimal and binary numbers, integers.
Mon. & Tues. Aug 30 and 31: Lab 2: Begin using IDL. Program: Barometric law
Weds., Sept. 1: Lecture: Complete computer concepts: floating point, ASCII, files, path.
Mon., Sept. 6: Labor day. No classes.
Mon & Tues., Sept. 6 and 7: Labor Day. No labs.
Weds., Sept. 8: Begin temperature and thermometers. Liquid-in-glass thermometers.
Mon., Sept. 13: Calibration of thermometers, max-min thermometers, instrument shelters.
Mon. & Tues., Sept. 13 and 14: Lab 3: Plotting US Standard Atmosphere and yearly NOAA GMST since 1880.
Weds., Sept. 15: Begin Chapter 2: Principles of instruments and measurements. A to D converters.
Mon., Sept. 20: Sensitivity, resolution, dynamic range, systematic vs random uncertainty, accuracy, precision.
Mon. & Tues., Sept. 20 and 21: Lab 4: CO2 data and Keeling curve. File header and monthly data.
Weds., Sept. 22: Begin electronic temperature sensors: thermistors
Mon., Sept. 27: Finish electronic temperature sensors (IC types, thermocouples, metal RTDs) and shields.
Mon. & Tues., Sept. 27 and 28: Lab 5: Using text editors, CSV files, and Julian date in IDL.
Weds., Sept. 29: Flaws in time-series graphs and scatterplots.
Mon., Oct. 4: Random errors, mean, variance, standard deviation, and standard error.
Mon. & Tues., Oct. 4 and 5: Lab 6: Term project discussion. Then, binary data files and scatterplots.
Weds., Oct. 6: Some important vocabulary. Then begin instrument time-response.
Mon., Oct. 11: Conclude instrument time-response and begin electromagnetic radiation.
Mon. & Tues., Oct. 11 and 12: Lab 7: Julian date and dual ordinate variables in time-series plots.
Weds., Oct. 13: Histograms, bar charts, distribution functions, and Planck functions.
Mon. Oct. 18: Derivation of Stefan-Boltzmann. Begin radiometers.
Mon. & Tues., Oct. 18 and 19: Lab 8: Planck functions with wavelength and frequency as independent variables.
Weds., Oct. 20: Radiometers: sensing solar radiation with pyranometers.
Mon. Oct. 25: Albedo, direct and diffuse solar, then IR sensing, pyrgeometers, emissivity.
Mon. & Tues., Oct. 25 and 26: Lab 9: 2-D arrays, loops, images, color bars, surfaces, and contour plots.
Weds., Oct. 27: Expectations for term project presentations. Then, begin atmospheric humidity.
Mon. Nov. 1: Ways to quantify atmospheric humidity, and begin ways of measuring it.
Mon. & Tues., Nov. 1 and 2: Lab 10: Saturation vapor pressure over water and ice.
Weds., Nov. 3: Completed humidity measurements and began barometric pressure.
Mon. Nov. 8: How to measure pressure: manometers, liquid barometers, pressure hypsometers.
Mon. & Tues., Nov. 8 ad 9: Lab 11: Least squares fit of a straight line to data --- including NOAA GMST data.
Weds., Nov. 10: QUERY_ASCII. Then, more barometers: flexible membranes, aneroids, vibrating cylinders.
Mon. Nov. 15: Quiz on barometers. Begin wind (log-wind profile) and wind sensors: plates, socks, and pitot tubes.
Mon. & Tues., Nov. 15 and 16: Lab 12: Eddy covariance: vertical turbulent fluxes over a strawberry field.
Weds., Nov. 17: Pitot tubes, angle of attack sensors, cup anemometers, vanes, propellors, sonics, and hot wires
Mon. Nov. 22: Thanksgiving week. No classes.
Mon. & Tues., Nov. 22 and 23: Lab 13: Thanksgiving week. No classes.
Weds., Dec. 25: Thanksgiving week. No classes.
Mon. Nov. 29: Student term presentations
Mon. & Tues., Nov. 29 and 30: Lab 13: Student term presentations
Weds., Dec. 1: Student term presentations
Mon. Dec. 6: Student term presentations
Mon. & Tues., Dec. 6 and 7: Lab 14: Student term presentations
Weds., Dec. 8: Student term presentations
Weds., Dec. 15: Comprehensive Final Exam: 12:00 PM - 1:50 PM.
Dr. Mayor's page
